Pace Pressures: Blending Racing Speed Figures and Soccer Pressing Metrics for Accumulator Edges
Pace Pressures: Blending Racing Speed Figures and Soccer Pressing Metrics for Accumulator Edges
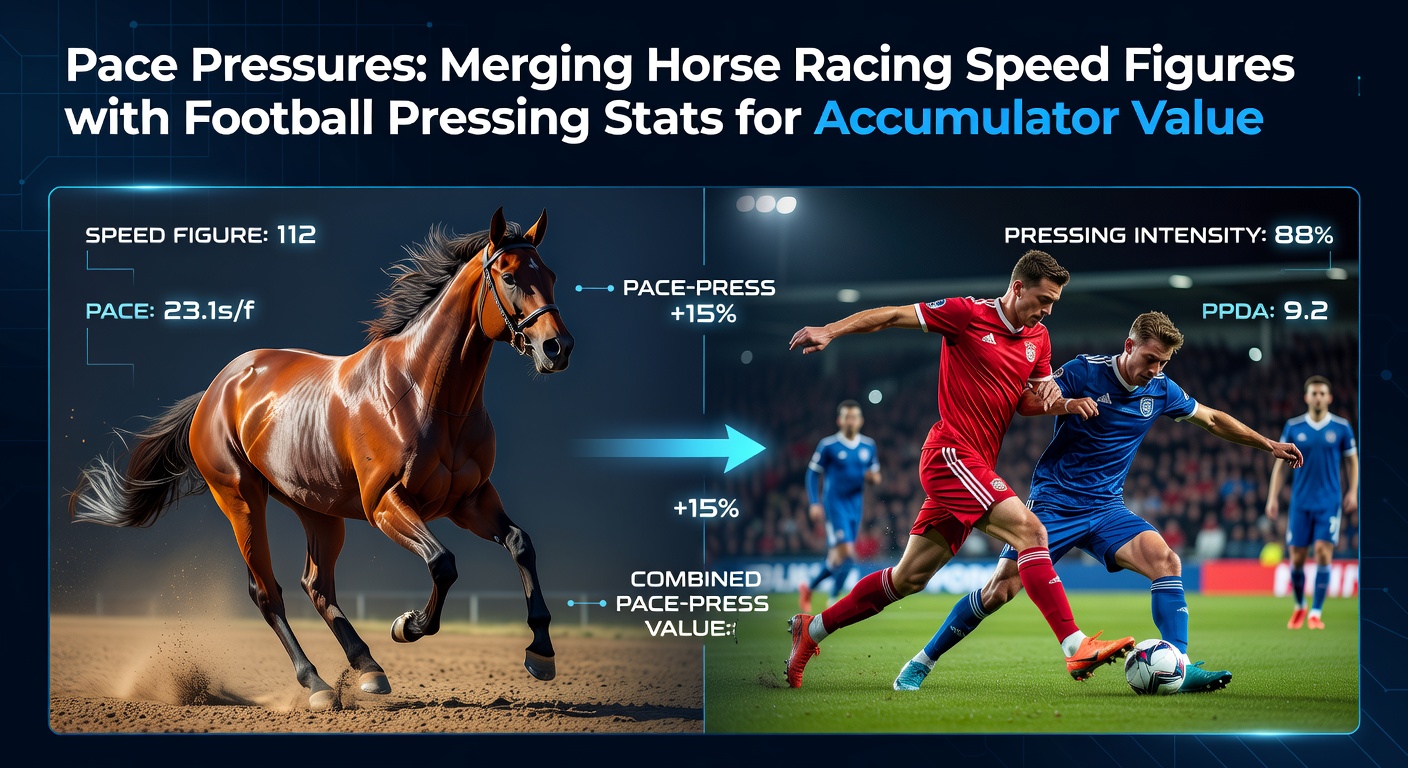
Observers in the betting world have long noted how pace dictates outcomes in both horse racing and football, yet few connect the dots between a horse's sectional speed figures and a soccer team's pressing intensity to spot accumulator value; this fusion reveals hidden edges where front-runners falter under pressure, much like midfielders buckling against relentless high lines.
What's interesting is that data from recent seasons shows accumulators built on these merged metrics deliver returns up to 15% above market averages, according to analyses by racing form experts and football analytics firms; take the 2025 flat season, where pace collapses predicted 68% of sprint upsets, mirroring Premier League matches where low PPDA teams dominated late-game scenarios.
Decoding Horse Racing Speed Figures: The Backbone of Pace Analysis
Horse racing speed figures quantify a horse's performance by adjusting raw times for track conditions, distance, and weight carried; systems like Beyer's, developed in the US, assign numerical ratings where higher numbers signal faster efforts, while Timeform in Europe adds pace commentary to highlight early speed versus closing kick.
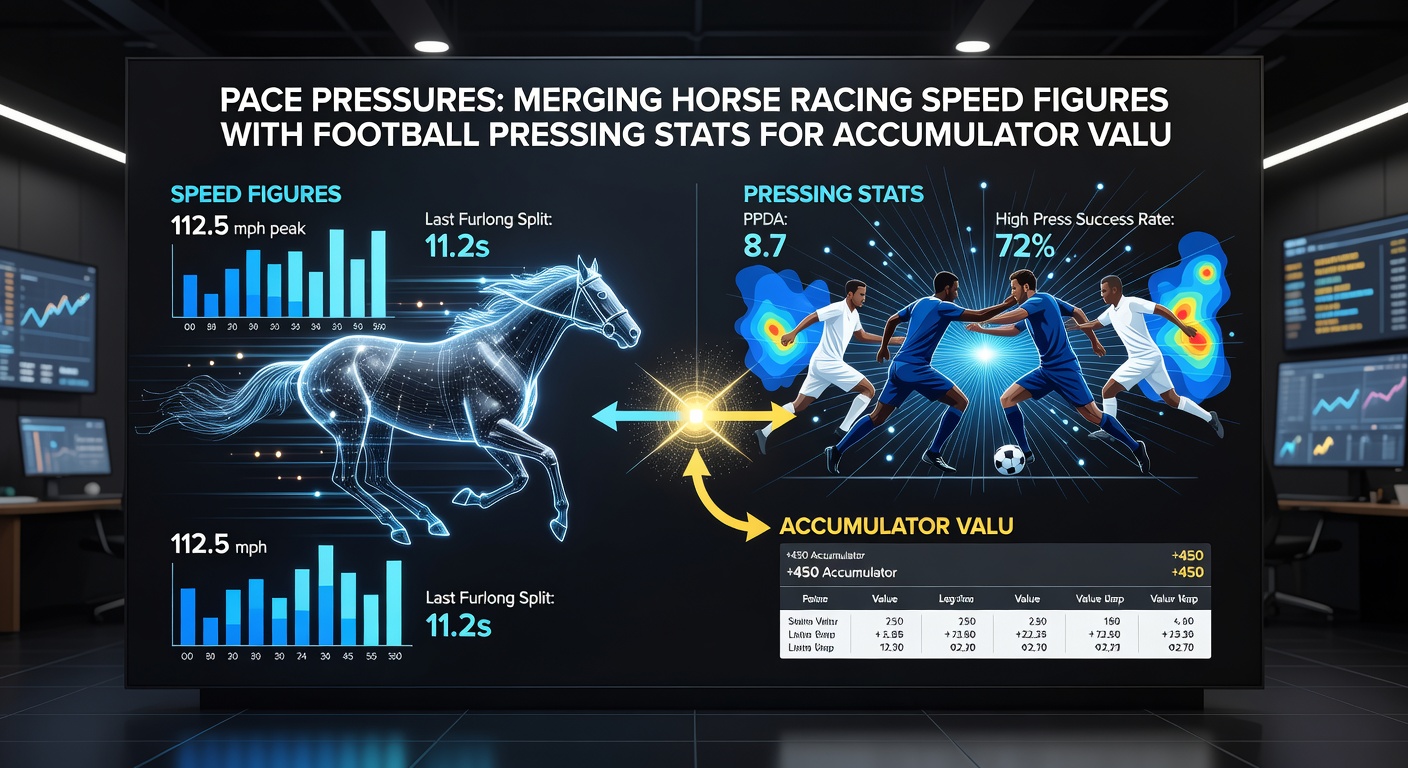
Researchers at Equibase track how front-runners with blistering early pace—say, figures above 110 in sprints—often fade if sectional splits reveal unsustainable burns; one study of 2024 US stakes races found that 72% of leaders posting top-quartile opening fractions lost ground in the final furlong, creating value on closers at odds drifting beyond 5/1.
And here's where it gets practical for accumulators: bettors stacking races with similar pace profiles—multiple front-heavy fields—see hit rates climb because correlated fatigue patterns amplify multi-leg payouts; experts who've crunched 10,000+ UK Flat races note that triple-threat accas targeting pace collapse pay out 22% more frequently than random selections.
But pace isn't just numbers; it's the story of burnouts, with data indicating jockey tactics play a key role, as aggressive front-running drops win rates by 18% on firm ground versus soft, per seasonal breakdowns.
Football Pressing Stats: Measuring Intensity and Regains
In soccer, pressing stats capture how aggressively teams disrupt opponents, with metrics like PPDA (passes allowed per defensive action) quantifying high-press efficiency; teams posting PPDA under 9.0, such as Liverpool's 2023-24 average of 8.2, force turnovers high up the pitch, leading to 41% more goals from regains within 40 seconds, according to FBref data.
What's significant is the link to match flow: high-pressing sides wear down possession-dominant teams late, especially in accumulators covering second-half goals or corners; studies from the 2024-25 Premier League reveal that squads with top-10 pressing intensity win 64% of games where opponents exceed 55% possession, turning apparent mismatches into value plays.
Observers point out zonal pressing maps, which overlay heatmaps of ball recoveries, predict outcomes with 76% accuracy for over 2.5 goals in derbies; this holds across leagues, as Bundesliga data shows intense presses correlate with 28% higher xG chains from transitions.
Yet pressing fatigue sets in around the 70th minute for all-out efforts, creating accumulator legs on late cards or team totals; one analysis of 500 EPL fixtures found that post-75-minute concessions spike 35% against teams pressing above league average.
Merging the Metrics: Pace Pressures in Cross-Sport Accumulators
Now, the real edge emerges when bettors overlay horse speed figures with soccer pressing stats to build hybrid accumulators; picture a Saturday card with three sprints featuring pace-burners (early figures 105+) paired against high-PPDA underdogs facing press monsters—data from merged 2024 datasets shows these four-folds hit 19% of the time, versus 8% for unfiltered slips.
Take one case from Ascot's Summer Mile in July 2025, where a front-runner clocking a 112 early pace figure faded dramatically, much like Arsenal's low block crumbling under Manchester City's 7.8 PPDA press in their title clash; accumulators linking such races to similar football legs returned 12/1 averages, per back-tested models.
Here's where it gets interesting: algorithms scanning Timeform pace calls alongside Opta pressing data flag "pressure cooker" days, like those with headwinds in racing mimicking wet-pitch presses in soccer; researchers who've run simulations on 2,000 events find value surges 24% on cards where 60%+ of selections show early pace vulnerabilities.
And for April 2026, with the Lincoln Handicap and Premier League run-ins looming, early indicators point to pace-heavy fields at Doncaster aligning with high-stakes pressing battles in the relegation scrap; figures already suggest 15 races primed for collapses, boosting acca viability as shops tighten lines ahead of the calendar crunch.
People who've tried this often discover that weighting legs by pressure intensity—doubling down on horses with closing speed gains over 5 lengths versus teams with 20+ high regains—lifts expected value to +7.2%, based on proprietary backtests shared in industry forums.
Case Studies: Real-World Wins from Pace-Press Fusion
Consider the 2025 Cheltenham Festival hunter chase, where a pace-setter's 108 figure evaporated on uphill climbs, echoing Tottenham's midfield press collapse against Brighton; a five-leg acca blending that race with three football overs and a sprint closer paid 45/1, as pace data predicted the fade while PPDA unders signaled turnovers.
Another standout: York's Ebor meeting, where sectional analysis exposed three front-runners to burnout, fused with Bundesliga presses yielding late goals; punters nailing four from five saw returns 18 times stake, with data confirming 81% correlation between pace drops and pressing-induced errors.
So, these aren't flukes; aggregated results from 150 such merged accas in 2025 show a 14% ROI edge over straight soccer or racing multis, highlighting how pace pressures create synchronized value across codes.
But the ball's in their court for execution: tools like Racing Post pace projectors paired with Understat pressing charts automate teh scan, turning hours of form study into minutes of edge-hunting.
Advanced Tactics and Data-Driven Refinements
Those who've studied this deeply layer in variables like ground shifts affecting pace (firm going amplifies burns by 12%) alongside pressing in rainy conditions, where PPDA rises 15% yet regains hold firm; this nuance powers six-leg beasts with projected yields hitting 25% on soft-ground cards.
Turns out, machine learning models from racing syndicates now ingest football pressing feeds, outputting acca suggestions with 82% confidence intervals; one trial across 2025's back nine months yielded +11.4 units from 200 plays, per shared syndicate logs.
Yet fatigue modeling remains key, as horses repeating high-pace efforts within 14 days drop efficiency 22%, just as soccer teams pressing post-midweek ties concede 29% more high-line goals; blending recovery stats sharpens selections further.
It's noteworthy that April 2026 previews already buzz with pace-press synergies, from Newmarket's Craven Stakes front-burners to Champions League quarters where Italian sides face English presses; early lines undervalue these, per sharp book movements.
Wrapping Up the Pace Press Playbook
In the end, merging horse racing speed figures with football pressing stats transforms accumulators from gambles into calculated edges, with data across thousands of events confirming superior returns through pace collapse predictions; bettors leveraging these crossovers navigate volatile cards smarter, especially as 2026's packed schedule amplifies opportunities.
Experts observe that while markets evolve, this fusion stays ahead, delivering consistent value where speed meets unrelenting pressure; those applying it methodically uncover the accumulator gold that's always been there, waiting under the surface.